The Multimodal Measurement Gap: Why Emission Data Gets Lost Between Ship, Train, and Truck
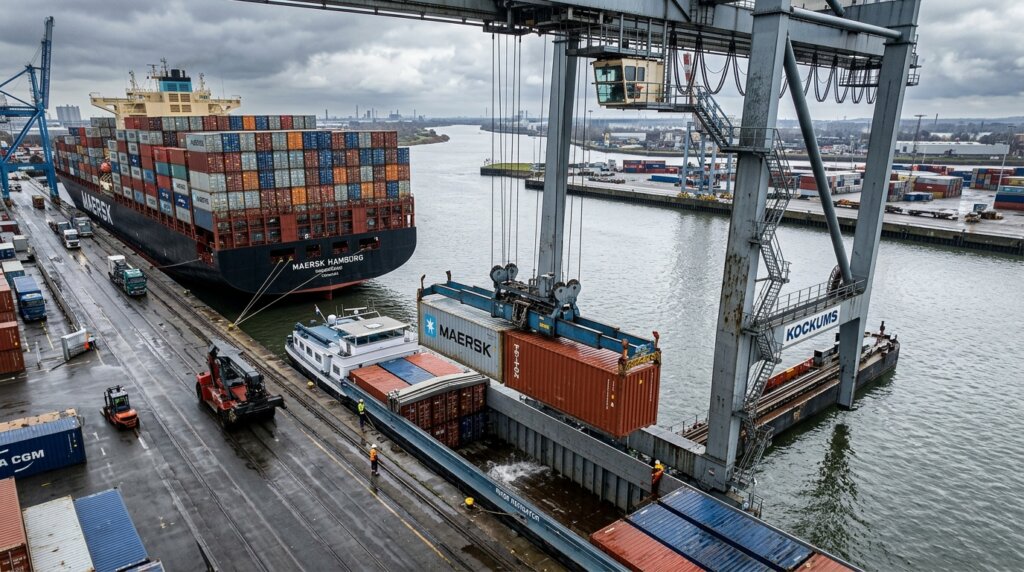
Where the Chain Breaks: From Terminal to Hinterland
During intermodal transport, structural data loss occurs the moment a container switches modes. Physical transshipment is highly streamlined; the data flow, however, takes a fragmented path. As goods cross the boundaries of closed digital ecosystems in the supply chain, primary emission data often stagnates at the terminal counter. A professional partner for accurate data processing helps companies capture this lost information and make it centrally available once more.
Ocean freight documentation is tightly organized. Shipping lines and large terminals communicate via standardized EDI protocols, which contain precise cargo data, weights, and distances. The moment a quay crane loads the container onto a truck or barge for hinterland transport, digital uniformity ends. The systems used by local road carriers and rail operators work in diverse formats, ranging from web portals and loose PDF files to physical paper CMRs. In the report CO2 Emissions Reporting: Challenges and Opportunities for the Logistics Industry, this transition is identified as the primary source of gaps in end-to-end carbon tracking.
Manual document handovers and front-desk processing cause immediate delays in source data collection. Transport planners are left waiting for drivers to submit paper waybills at the end of the workweek, bringing real-time emission calculations to a standstill.
| Transport Mode | Typical Data Standard | Primary Medium | Impact on Emission Tracking |
|---|---|---|---|
| Ocean Freight | EDI or API (standardized) | Digital | High: accurate integration possible |
| Inland Waterway / Rail | Diverse: XML, web portals, PDF | Digital / Print | Medium: often requires conversion for TMS |
| Road Transport (local) | Proprietary TMS format or no standard | Paper or eCMR / PDF | Low: manual entry severs source data |
The Clash Between Systems and Paperwork During Terminal Handovers
The gap between digital EDI messages and unstructured local waybills creates irreconcilable holes in transport records. EDI requires strict field mapping where every data point—from gross weight to reference number—matches exactly. As soon as physical onward transport begins, the local carrier generates documentation based on their own protocols and processes. The Digitalisation and Electronic Freight Transport Information (eFTI) initiative highlights how differing interpretations of documentation requirements disrupt supply chain transparency. A front-end digital system expects seamless data feeds but practically receives copies of customs papers and incompletely filled-out waybills.
Losing the Tracking Number
As soon as a sea container is transferred to a truck, the carrier creates a new trip in their own Transport Management System (TMS). The technical logic of these systems forces the generation of a new, unique trip or reference number. This often overwrites or ignores the original overarching shipment number. Consequently, the specific cargo’s emission factor becomes disconnected from its historical freight data. According to guidelines surrounding the Electronic Consignment Note (eCMR) – UNECE, digitizing the waybill offers potential, but a lack of universal adoption means reference numbers must be copied manually—a step frequently skipped or plagued by typos.
The Impact of Fragmented Sources on Scope 3
Directly quantifying operational risks starts by analyzing these data leaks on a reporting level. When primary source data is missing or becomes illegible due to format changes, reporting standards like the GLEC Framework 2.0 force companies to fall back on industry averages (default values). Without verifiable logistical activity at the trip level—such as actual fuel consumption or exact payload capacity—the methodology relies on conservative estimates to prevent under-reporting.
This creates an artificially inflated carbon footprint. Companies operating under the Corporate Sustainability Reporting Directive (CSRD) are judged on the accuracy of these emission figures. The document Frequently Asked Questions: Corporate Sustainability Reporting Directive (CSRD) clarifies that audit trails strictly monitor the use of measured source data for Scope 3 emissions versus estimated values. This missing link forces back-office teams into time-consuming investigative work: routes have to be reconstructed retroactively using loose invoices, weighbridge tickets, and email threads just to submit a more accurate calculation.
Calculation Example: Data Drop-off on the Rotterdam – Duisburg Route
The consequences of failing data transfers directly translate into inaccurate carbon footprints. The Technical Guidance for Calculating Scope 3 Emissions – GHG Protocol and the research STREAM – Study on Transport Emissions of All Modes (Update) lay the foundation for emission calculations where distinguishing between modal shifts determines the final result. This step-by-step example illustrates the exact impact of data drop-offs:
- Arrival at Rotterdam deep-sea terminal: The shipment is registered under master bill of lading X123. EDI messages round off the maritime emissions calculation based on the Shanghai – Rotterdam route.
- Transshipment to inland barge: The cargo (gross 20,000 kg) travels by barge to Duisburg. The operational emission factor for inland shipping is highly efficient in terms of ton-kilometers (~20 grams CO2e/tkm).
- Data drop-off on the Duisburg quay: Upon arrival, the barge is unloaded. A local transport company physically collects the container by truck, accompanied by a handwritten CMR that lacks the original X123 reference number.
- Calculation with missing parameters: At the end of the quarter, the shipper consolidates the data. Because the link between the barge and road transport is broken, the back-office emission system only registers the starting point (Rotterdam) and the final destination (the warehouse in Germany) for the completed logistics orders.
- The result — a conservative penalty: The algorithm applies the fallback method. Instead of crediting the highly efficient inland barge segment, the system calculates the entire Rotterdam-Warehouse route as road transport (e.g., as a heavy-duty truck with an emission factor of ~75 grams CO2e/tkm). The reported Scope 3 emissions for this shipment end up being over three times higher than they actually were.
The Vulnerability of Hinterland Transport on the Spot Market
Data stability varies drastically depending on the contract type. Fixed, long-term logistics contracts (dedicated fleets) utilize uniform data protocols. With these partners, Service Level Agreements mandate interoperability between the shipper’s ERP system and the carrier’s TMS. Primary data is systematically safeguarded.
The dynamic nature of the spot market completely disrupts this process. Ad-hoc trips are outsourced to a highly fragmented group of subcontractors, each using different—or sometimes no—TMS solutions. Here, data lives exclusively on isolated mediums, making it impossible to retrieve actual emission factors without manual intervention and file verification.
Why API Connections Stumble Over Freight Documents
Technological interventions, such as pure API integrations, do not offer an adequate solution for intermodal data management. Software connections excel in standardized environments, but the heterogeneity of external logistics chains often forces these systems to a grinding halt.
APIs are designed to process predefined data streams asynchronously. The unstructured reality of global transport documentation refuses to fit politely into these prescribed boxes. A McKinsey study, Green Supply Chain: How Digitization Can Help You Reduce Your Carbon Footprint, points out that system-to-system solutions crash at the slightest deviation or pollution in input data—such as a crossed-out and manually corrected weight declaration on a customs document. Software lacks the context to determine which value should be accepted as the truth in such scenarios.
The Slowdown Caused by Unstructured Data
The structural expectations of an internal Enterprise Resource Planning (ERP) platform differ fundamentally from what a truck driver hands over in real life. ERP systems demand payload data in formats like XML or JSON. The driver hands over a physical piece of paper covered in warehouse workers’ scribbles, customs stamps blurring the margins, and incomplete fields. This transition from physical paper to a digitally readable format creates a jungle of unstructured data. Flatbed scans that are slightly misaligned, or low-resolution email attachments, often cause automatic text recognition (OCR) systems to freeze halfway through processing.
Interpreting Inconsistent Units of Measurement
Automated calculations frequently fail simply due to variations in transport metrics. While one carrier might report trip allocations in total liters of diesel consumed, another operator issues invoices expressed in ton-kilometers or Twenty-foot Equivalent Units (TEU).
The moment source data records a unit of measurement that deviates from a predefined format (e.g., ’30 lbs’ instead of ‘13.6 kg’), calculation modules break down. These variations demand manual corrections. As a result, the streamlined API integration originally promised devolves into a fragmented, error-prone dataset in the core registry.
Hybrid Processing as the Essential Foundation
Eliminating gaps in emission accounting requires consolidating unstructured data through a hybrid approach. The publication Guidance on Data Quality for GHG Emissions – Smart Freight Centre outlines strict quality requirements for source data in emission reporting; relying purely on rudimentary data quality is a direct risk to compliance and business continuity.
Building reliable reporting systems requires a sequential workflow where Robotic Process Automation (RPA) handles high-volume data extraction. This software “scrapes” recognizable information from digital platforms and standardized forms. Human validation—also known as a hybrid data validation method—functions in direct succession to identify and correct contextual errors. Closing this gap between disparate modal data silos creates solid emission dashboards built on verified foundations.
Human Validation as a Safety Net for RPA
Influxes of non-standard data force exception reports in any automated extraction system. A customs document with complex attachments or an irregular classification code blocks the RPA loop. Human context can immediately recognize the specific anomaly based on operational knowledge of transport routes. The quality controller visually validates the data and interprets the intent behind manual cross-outs or stamps with conflicting dates. This review step keeps data accuracy intact without bringing the entire process to a standstill over a single exception.
From Fragmented Logs to Audit-Ready Data
The ultimate goal is to structure a dataset capable of withstanding rigorous inspections under upcoming CSRD audits. Transforming raw, fragmented source data into an airtight registry is purely about control. Hybrid validation restores the data links broken during modal shifts. This eliminates the black boxes within the supply chain, ensuring the entire trip history—from ocean freight in Shanghai to its arrival at a European distribution center by road—can be accurately reproduced and justified during external audits.
The structural breaking points between maritime, rail, and road transport illustrate just how complex pure primary data processing is in practice. Fully automated systems falter at paper-based inconsistencies, forcing companies to fall back on conservative estimates that heavily skew their emission profiles.
To gain true insight and prepare for strict emission regulations, validating modal data is the immediate next step. DataMondial unites highly trained professionals with RPA technology within a strategic nearshoring facility in Romania; this creates an EU-compliant, scalable hybrid model. Explore how you can outsource order processing and data entry and how building audit-ready datasets with guaranteed cost control can strengthen your logistics reporting.